Bayesian Nets: from white-boarding to laser cutting
🔥 Immortilizing graphical models with laser cutters 🔥
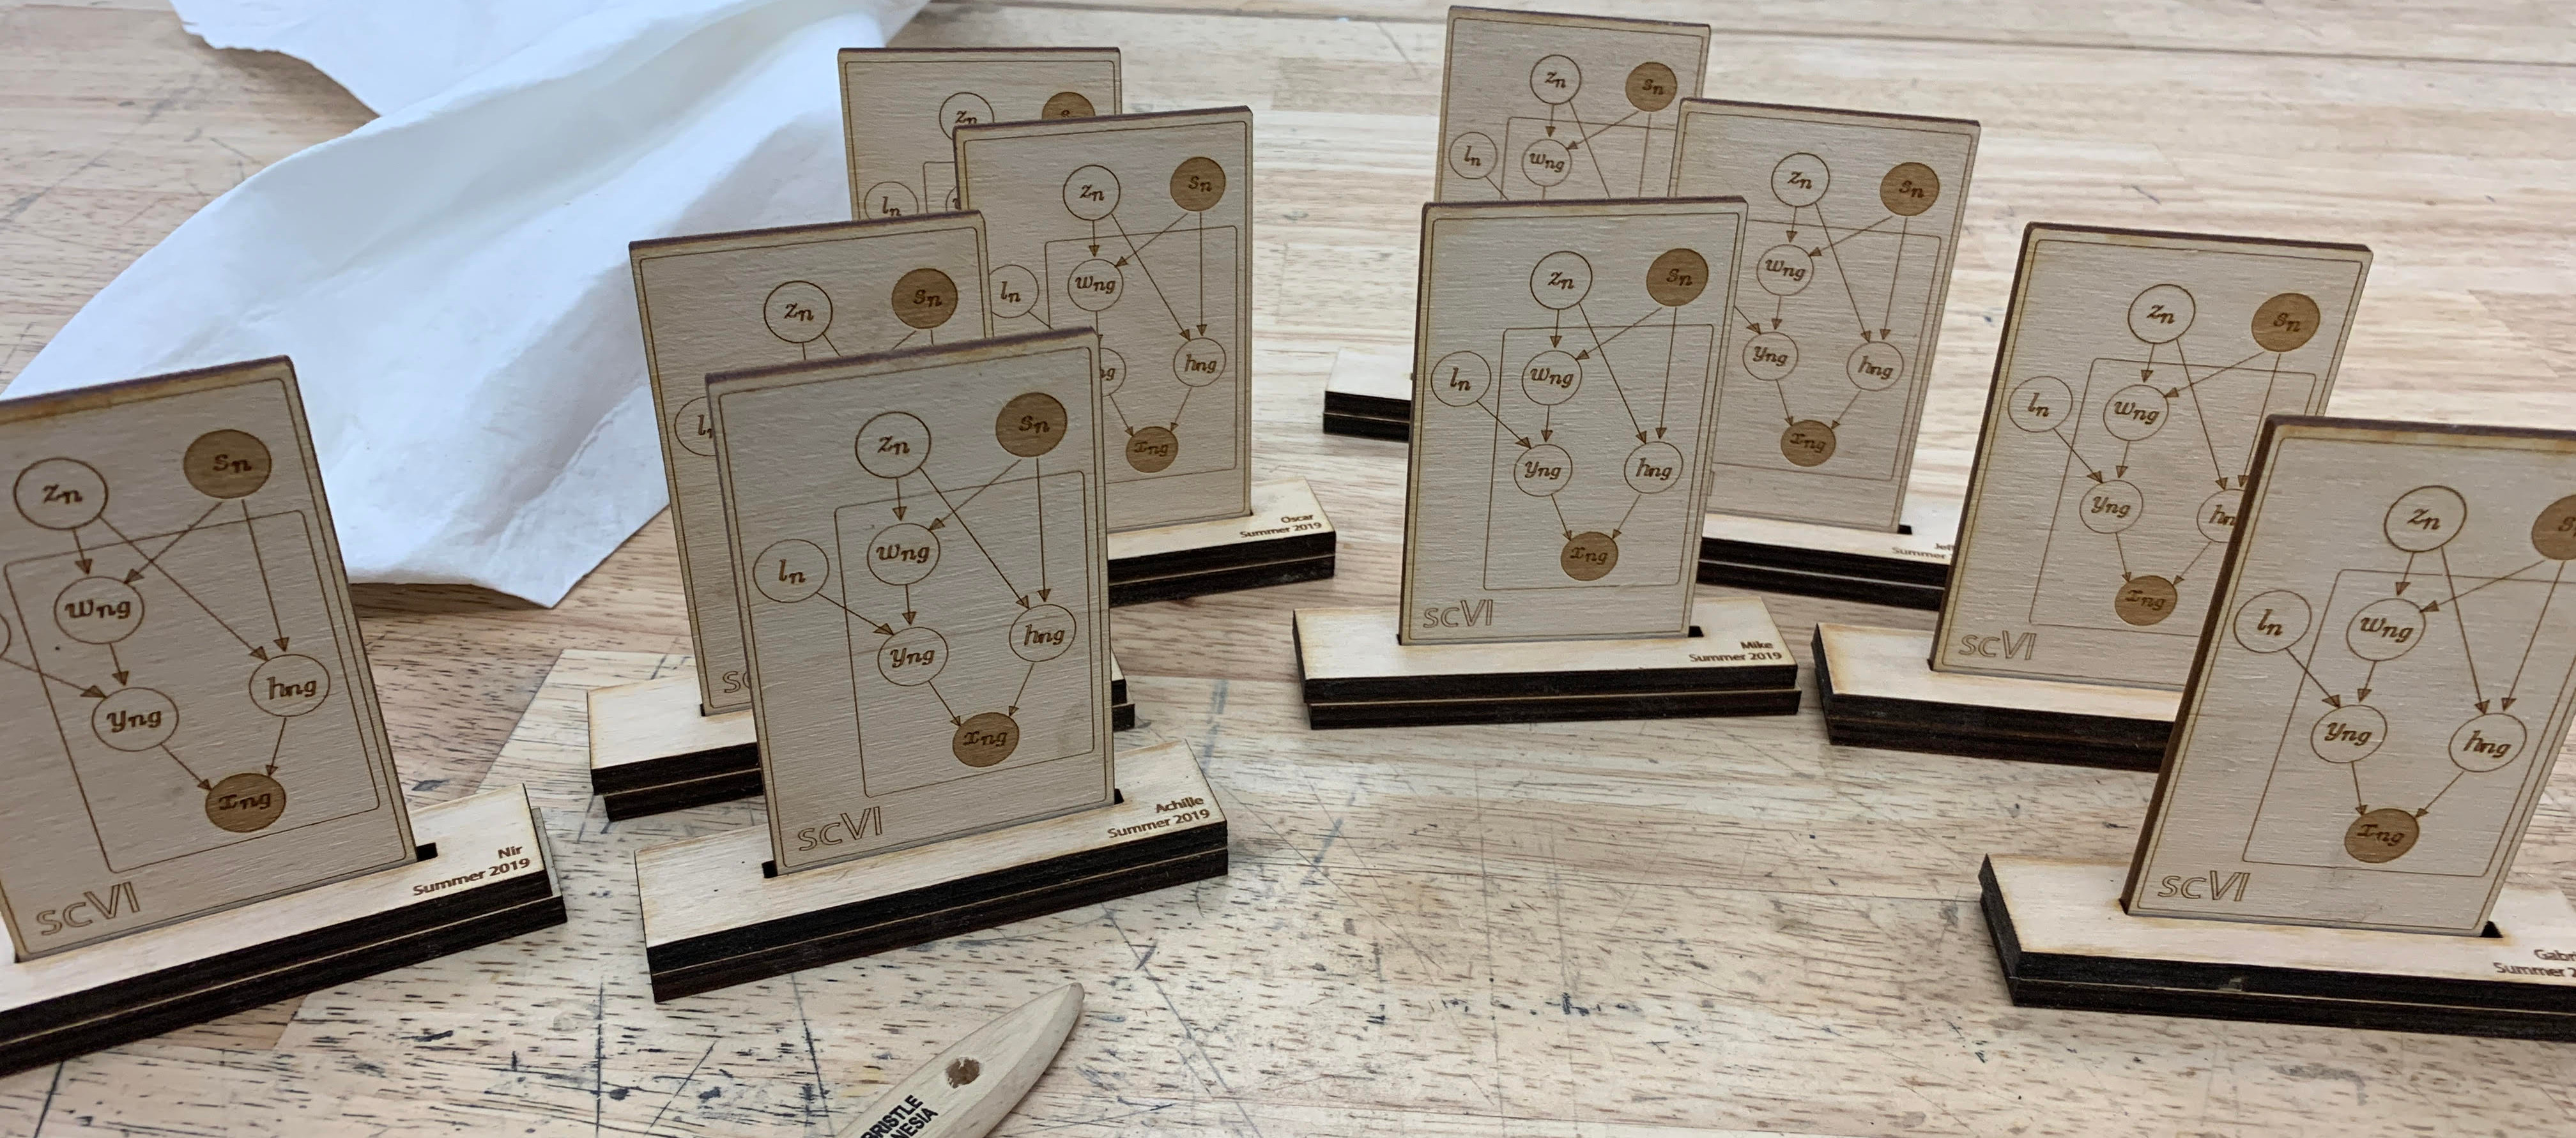 An army of Bayesian networks freshly cut @Jacobs Hall, Berkeley
Thanks for visiting this page! I present here a small side project I worked on for fun earlier on in my PhD (2019), in which I engraved graphics from my research on wood using a laser cutter available on the Berkeley campus. The first part of this blog post describes formally why I enjoyed this project: it reconciled a few dissonant thoughts I had about the process of “model building”. The second part explains my design choices and also serves as a tutorial for reproducing similar artworks, starting from your own graphics.
Scientific modeling: what does it mean to “build” a model?
My introduction to the abstract concept of “modeling” dates back to my first high school physics lecture. We read in class the famous parable of the blind men and the elephant. In this short text, six blind men together approach an elephant and attempt to draw conclusions about its nature. Examining it from the side, the first man compares the animal to a wall, based on the toughness of its skin. Another man touches the elephant trunk and allegedly claims that the mammal actually resembles a snake. The remaining men propose yet different hypotheses about the nature of the elephant. This parable has been used for commenting on alterity and religious tolerance but also has more modern scientific interpretations. Indeed, it was explicitly analyzed in several papers from multidisciplinary fields, including a mathematical education monograph. This is understandable because the men collectively accumulate knowledge that may be cohesively put together into a model, a representation of the elephant. This parable is also very relevant in my field of research, studying cellular mechanisms that characterize a cell’s identity. Only recently, researchers developed experimental assays to quantify several molecular processes at the single-cell level such as the transcriptomic variations, chromatin accessibility, and DNA methylation. Each of those views offers an incomplete picture of individual cells, but together may be used to create a descriptive and insightful model of cellular circuitry. During my PhD studies, I became especially interested in building mathematical models of those cellular processes. Towards this end, I have relied on a specific language brought by probability and Bayesian statistics commonly referred to as Bayesian networks.
My point of reference for the word “building” is, however, much older. My father, now retired, was employed as a bricklayer. Looking back on my childhood, I specifically remember him pointing out houses as we drove through the chestnut wooded hills near my hometown. “I built that one in 1992, it was a really cold winter.” – he would say. Quite impressed, I used to wonder what I would myself end up “building”. For a while, these thoughts remained incompatible with my insatiable appetite for solving mathematical problems in undergraduate studies. It was only after receiving several inquiries about my very first model in graduate school that I wondered. Had I “built” something? If so, in what sense? Are the two processes of building a house and a model at all related?
I encountered some informal answers to those interrogations in the book “Shop Class As Soulcraft: An Inquiry Into the Value of Work” by Matthew Crawford. In this fun and engaging read, Crawford narrates his transition from philosophy to motorcycle repair. Feeling alienated in his office work, Crawford became an enthusiastic proponent of manual craftsmanship, going so far as to denounce a large class of white collar jobs. While reading the book, I could not help but notice similarities between his definition of craftmanship and my algorithmic work:
Craftsmanship means dwelling on a task for a long time and going deeply into it because you want to get it right.
To clarify the link to my research, let me expand on it by taking a concrete example:
- Most applied statistics work stems from a need or a task, for example, jointly analyzing several transcriptomic datasets from several patients. This is especially relevant when studying the effect of a disease on, for example, the immune system.
- With this task in mind, one may examine existing literature to analyze a single dataset, and gather several ideas on how to account for heterogeneity across patients. The most promising idea may be used to design a graphical model by relying on the language of Bayesian statistics. Even then, it is not an easy task because a single mathematical idea may be numerically implemented in multiple ways.
- For the proposed model, one must design an algorithmic procedure (often called inference) to compute the quantity solving the task. For example, if we explicitly model the patient-specific gene expression as X, then we may estimate the effect of the disease on the population of immune cells as f(X).
- Then, one must rigorously critique the model to verify its accuracy. This operation is generally performed by evaluating the model on simulated data, where the expected result is known, as well as on real data by comparing the model’s answer to our (limited) biological knowledge.
- Finally, one may repeat those steps until the model is functional and performant. In my case, the stopping criterion for this loop was my advisor’s evaluation of the usefulness of the algorithm for the scientific community.
The parallel now appears rather clearly. Model building is a process that is iterative in nature. It is usually referred to as Box’s loop: Design, Compute, Critique, Repeat. Following this methodology requires (a) a deep understanding of the process one wants to model, but also of statistical inference, (b) a clear criterion for success, and (c) an astronomical amount of time and patience. From my experience in computational biology, it usually takes from six months to a year of work to provide a useful model for the research community. Building those models is gratifying too: some of the ones I built have been applied to understanding diseases and defining biological targets for drug development. Crawford himself may not consider machine learning research as fitting his definition of craftsmanship. Still, the process I follow in my research seems closer to soulcraft than to the alienating office work Crawford despised.
Not everybody shares my opinion about whether this parallel makes sense beyond pure semantics. A house is where a family lives. A drug affects biological organisms and cures diseases. What does a model or a GitHub page achieve by itself, concretely? It is difficult to apprehend for many people, because neither molecular biology nor Bayesian statistics are tangible concepts. Think about it, you just cannot hold a cell, a molecule, or a probability measure in your hands! When I started learning wood engraving, I therefore wanted to build something that would capture the essence of my research. Down the road, it became a fun and nerdy trophy, given to all the members of the team.
Laser Engraving of Bayesian Networks
I learned how to use one of the PLS6.75 machines from Universal Laser Systems, available at Jacobs Hall on the Berkeley campus. These laser cutters are convenient because they interface perfectly with Illustrator, a tool that researchers often use to prepare scientific figures. On the most basic level, these lasers can perform three different operations:
- Cutting: literally cutting through a slice of the desired material;
- Engraving: making a clean cut onto the wood based on a pre-defined vectorized trajectory;
- Rastering: quickly burning the surface of the wood to render a pixel image;
There is a specific code of width and color employed by the laser cutter to encode those modes (rest is rasterized). I quickly played with all of those functions to get a feeling of what I could achieve. In particular, I was astonished by the cleanliness of the cut for the engraving function and quickly suspected that LaTeX fonts would render very nicely. Based on this, I converged on the format of a plaque / trophy as it would be easy to put on a desk and presumably a great gift for collaborators. Also, I selected three graphics to include on this plaque:
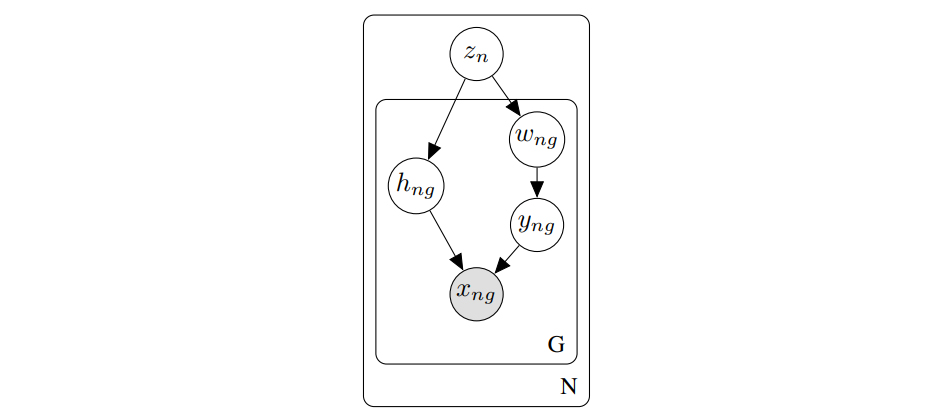
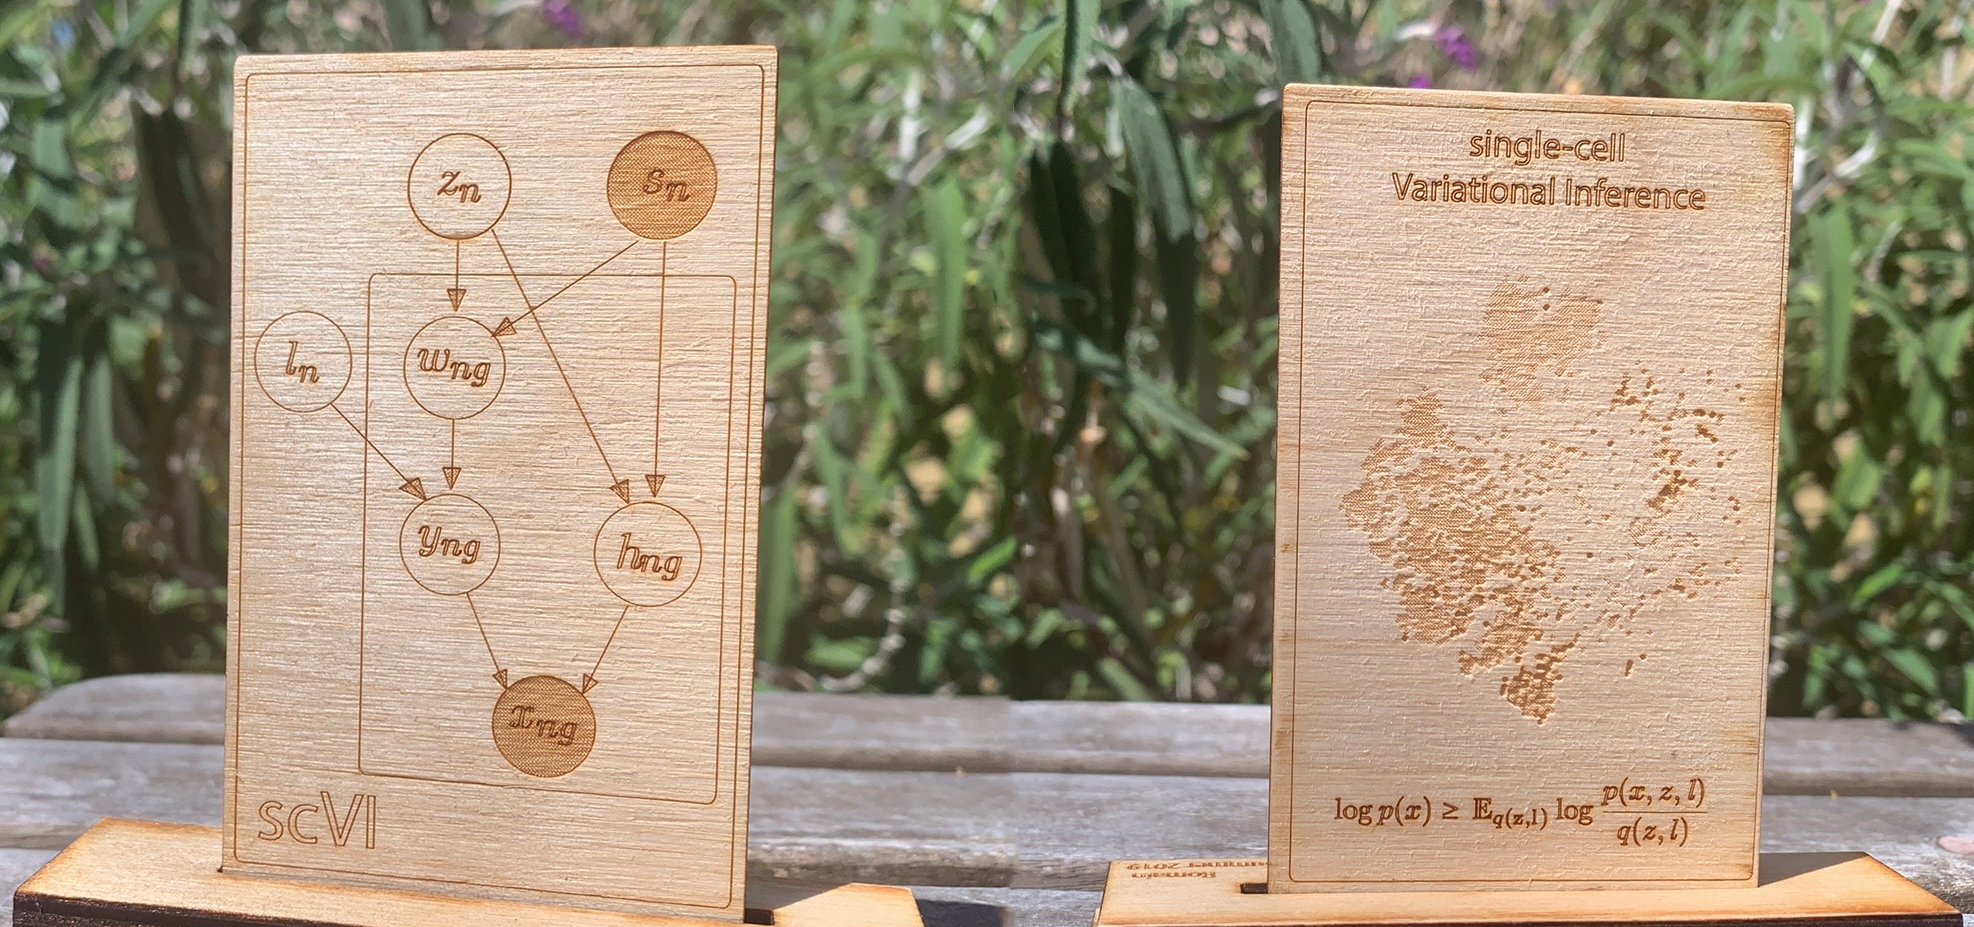
- scVI’s graphical model: a condensed representation of the probabilistic model behind our research.
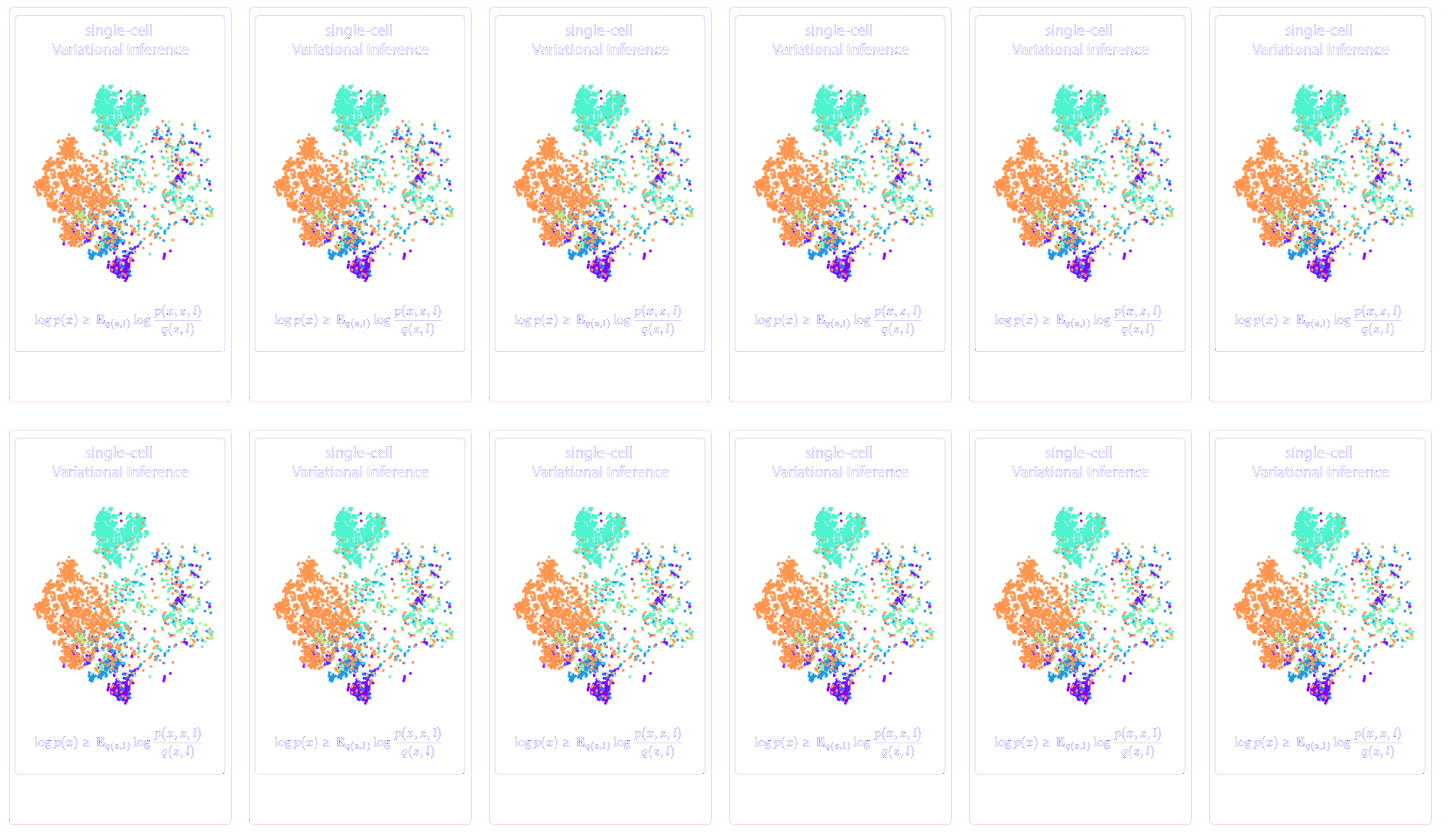
- The evidence lower bound: an emblematic inequation that underlies variational inference (recipe of approximate inference for Bayesian models).
- A scatter plot based on real data: such plots are ubiquitous in transcriptomics analyses.
I now present some details about each of those elements. The plaque was cut out of a single wood slice. More thought could have been put into the material, but this was the faster way to get started.
The design
The trophy was formed by fitting a vertical plaque upright into a rectangular stand. I built the stand out of two hollow rectangles, glued together with wood paste for sturdiness. On the surface of the stand, I engraved the name of the recipient (collaborators & interns), as well as the date:

The two-sided decorative plaque contained the three graphics, designed as follows.
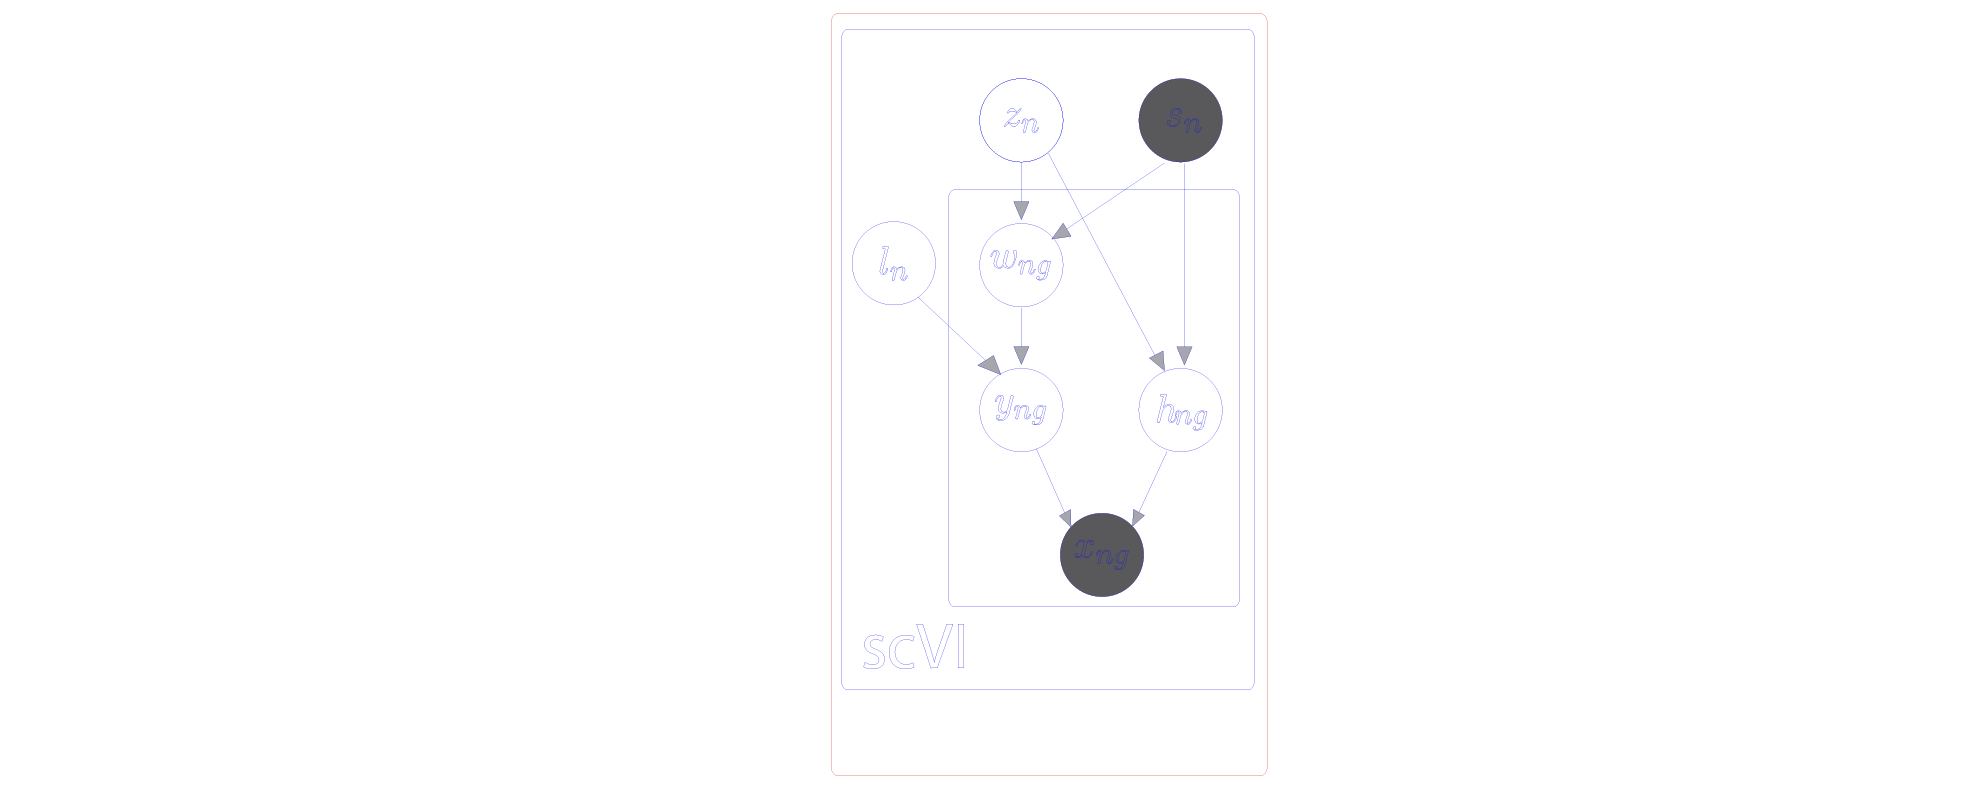
The graphical model & evidence lower bound
I used the TikZ library tikz-bayesnet to draw scVI’s graphical model in LaTeX, and exported it as a PDF file.
 I then imported the PDF file along with the fonts into Illustrator, and carefully edited the content so that the laser understands the paths as engraving instructions.
 I proceeded similarly for the evidence lower bound.
The scatter plot from real data
I included a tSNE plot, representing a real dataset of immune cells as processed by the scVI model. Because the dataset had more than eight thousand cells, and it would take too long for the laser to engrave that many circles, I opted for a rastering option. On Illustrator, the back of the plaque looked like this:
The final result
After some trial and error, I was able to quickly put together a small wooden plaque (the Illustrator file to reproduce the artwork is here). I tried different settings of laser intensity, and then reproduced around ten of those plaques to give around:
I really enjoyed the engraving of the Bayesian network that I had struggled so much to conceive in the first place. In particular, I had to iteratively adjust the contrast of the grey nodes of the network. On the back, I like how each cell type has a different laser intensity, which brings an impression of depth. This suggests that there is some heterogeneity in this cloud of points that is reflective of the underlying biological processes. I offered these plaques for a team dinner as goodbye gifts for interns. This simple object will always bring me back memories of a fun and productive summer.
Acknowledgements
I would like to warmly acknowledge Olivier Krygiel for this wonderful high school class. Thanks to Jim Kaminski for inspiring me to learn how to use the available machines at Jacobs Hall and to Geoffrey Negiar for getting me to read Crawford’s book. Merci to Anna Matlin for providing feedback on the writing. Finally, I express sincere gratitude towards Cliff Stoll for encouraging me to produce nerdy artwork.
Romain Lopez
Assistant Professor of Computer Science and Biology
My research interests lie at the intersection of statistics, computation and modeling of biological data. A significant part of my research is driven by building more statistically accurate and faster machine learning software for analyzing genomics data.